RYI (RYI)·Q4 2025 Earnings Summary
Ryerson Misses Q4 as LIFO Surge Crushes Margins; Guides to Recovery in Q1
February 6, 2026 · by Fintool AI Agent
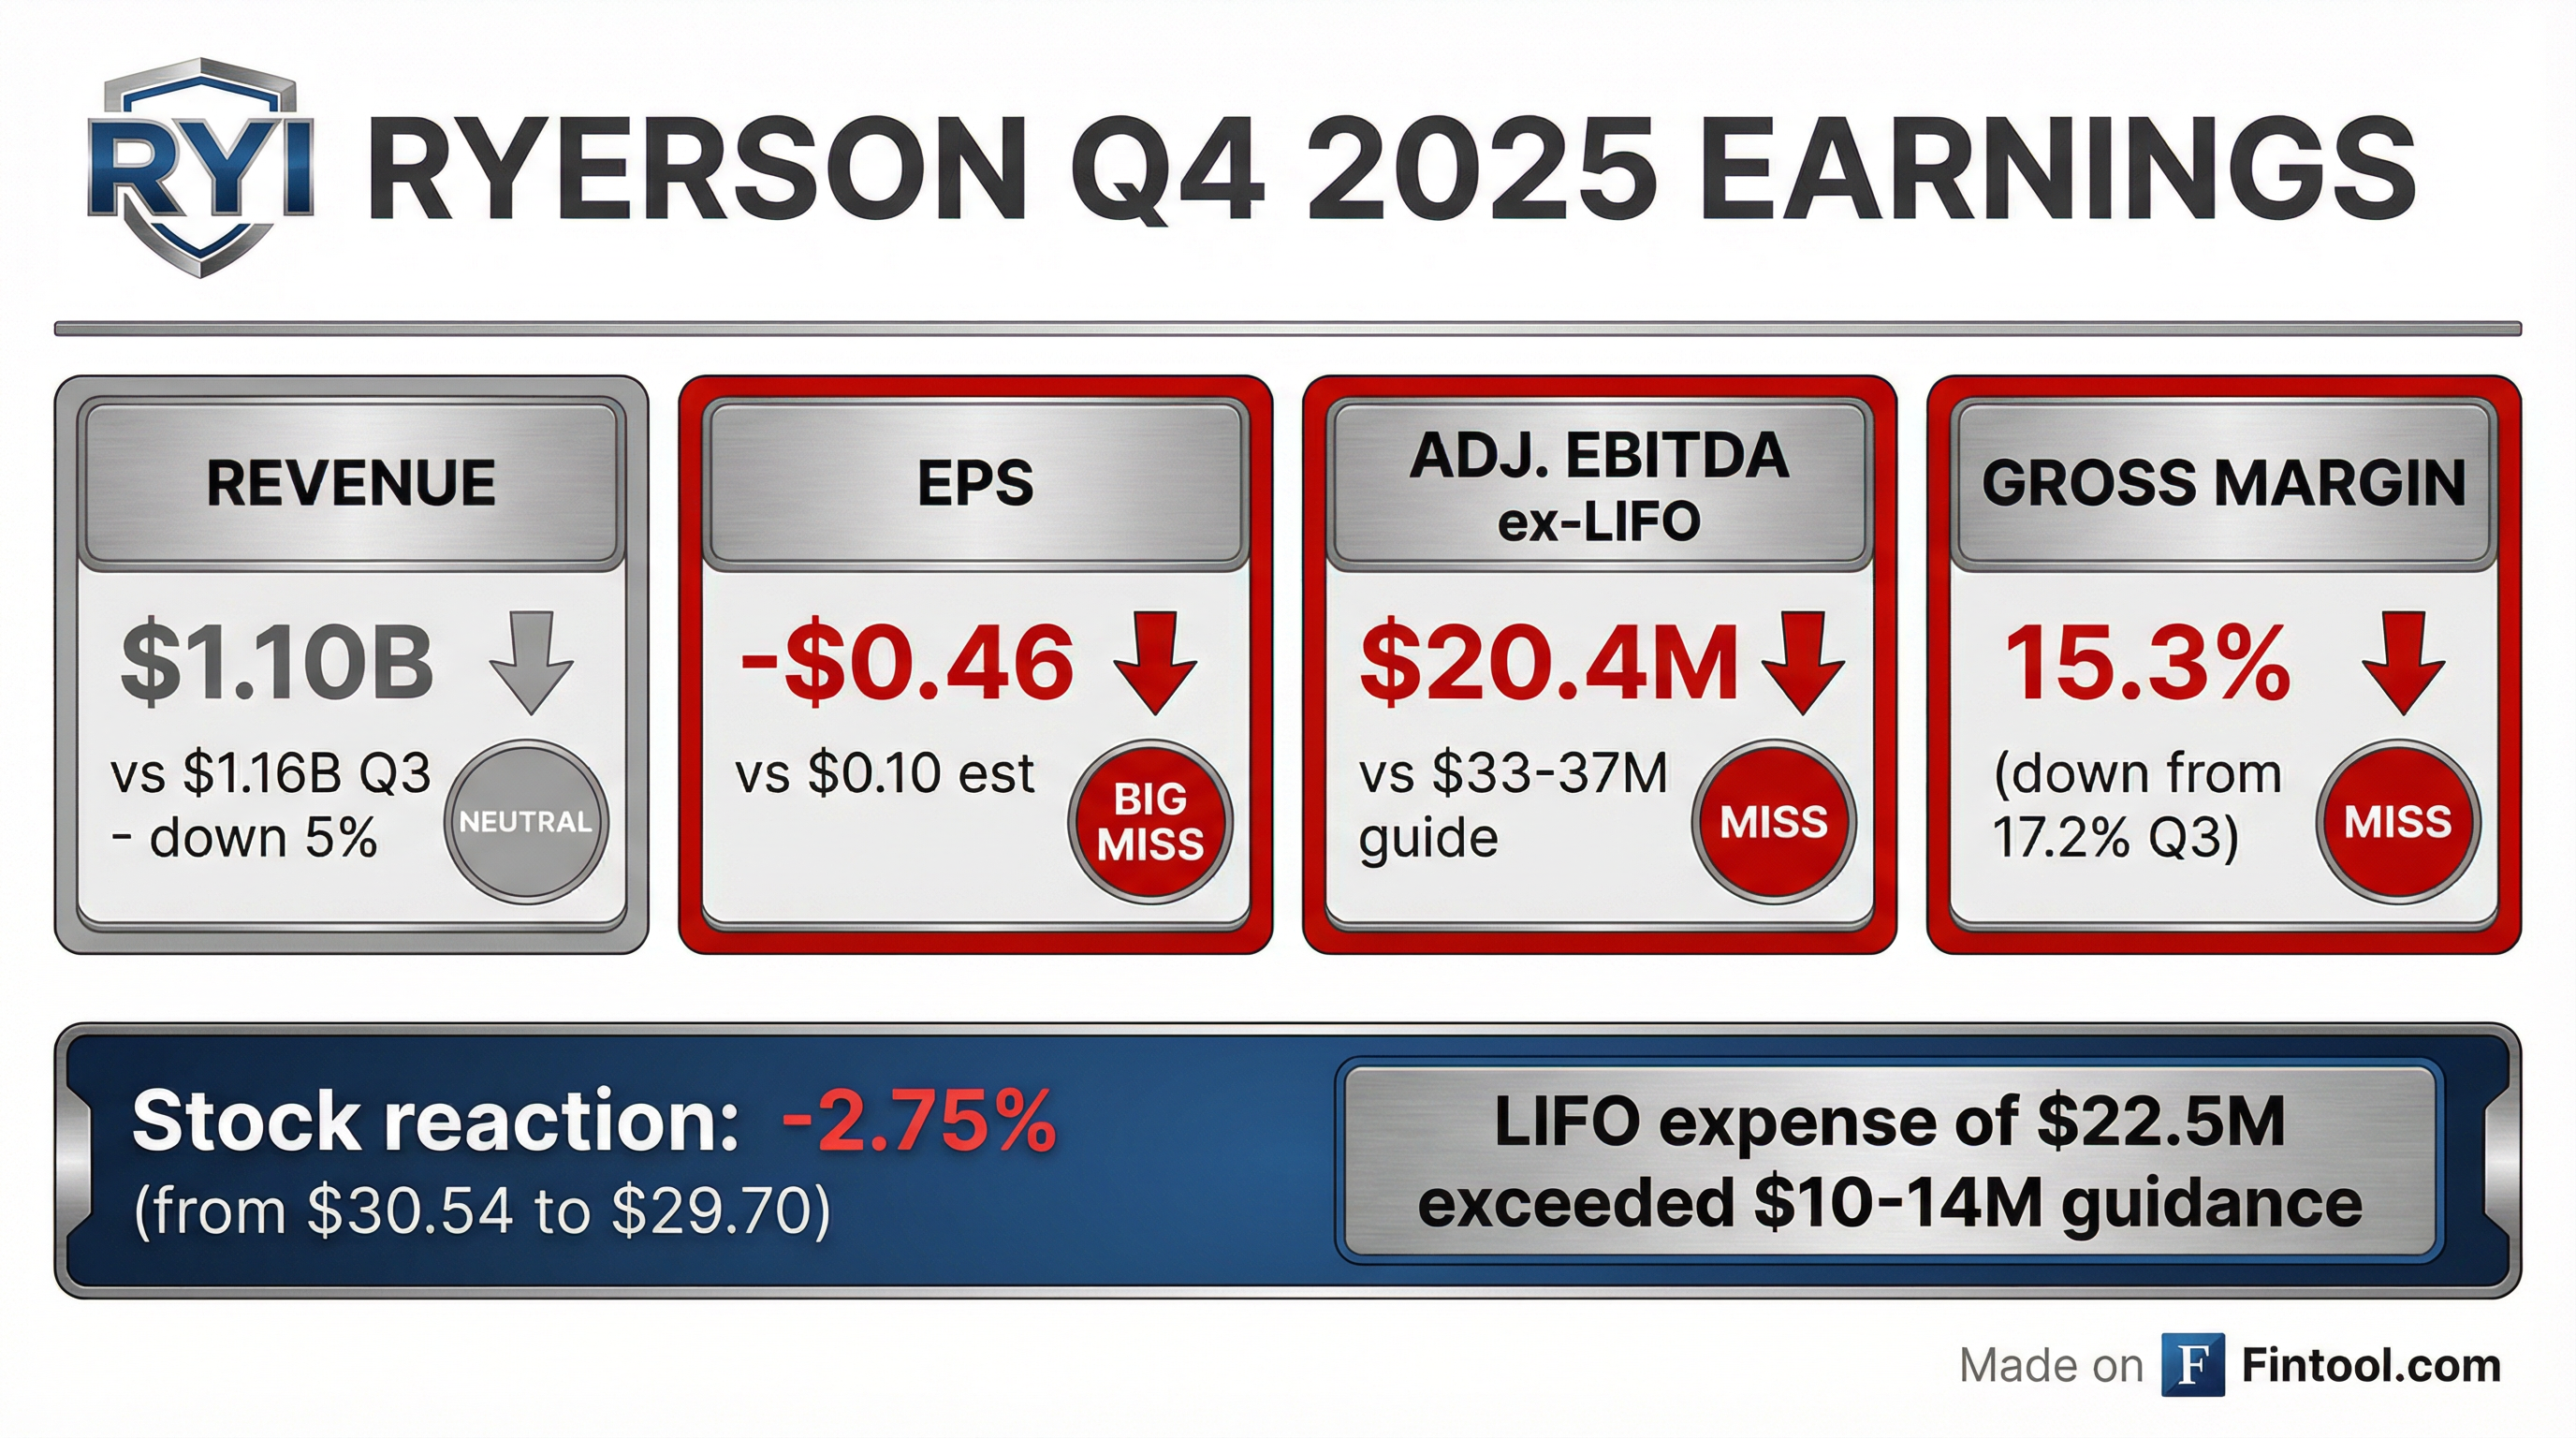
Ryerson Holding Corporation (NYSE: RYI) reported a significant Q4 2025 earnings miss, with normalized EPS of -$0.46 falling well short of the $0.10 consensus estimate . The metals distributor's quarter was derailed by an unexpected surge in LIFO inventory expense that crushed gross margins, though management pointed to strong early-2026 bookings and guided to a meaningful Q1 recovery. The stock fell 2.75% on the news.
Did Ryerson Beat Earnings?
No — a significant miss on EPS and Adjusted EBITDA.
*Values retrieved from S&P Global
The culprit was clear: LIFO inventory expense of $22.5M exceeded guidance by 60-125% . Material input costs rose faster than Ryerson anticipated during the quarter, while resale prices remained flat due to normal contract pricing resets and soft industrial demand on spot business .
Excluding LIFO, gross margin decreased by only 100 basis points QoQ to 17.3% — still a compression, but far less severe than the headline 190 bps drop .
How Did the Stock React?
RYI shares fell 2.75% from $30.54 to $29.70 following the earnings release . In after-hours trading, shares dipped further to $29.45.
The stock had rallied ~50% from its 52-week low of $19.02 heading into this report, lifted by the Olympic Steel merger announcement in October. Despite the Q4 miss, shares remain well above year-ago levels.
What Caused the Margin Compression?
Three factors combined to squeeze Ryerson's profitability:
-
Material cost surge: Input costs rose faster than anticipated during Q4, creating a COGS headwind before prices could be passed through
-
Flat selling prices: Average selling prices were essentially unchanged (+0.1% QoQ) as normal contract pricing resets and soft spot demand prevented markup expansion
-
Volume decline: Tons shipped fell 4.9% sequentially due to normal seasonality and soft industrial demand
Operating expenses were largely in-line at $206.8M, though this included $7.8M in advisory fees related to the Olympic Steel merger .
What Did Management Guide?
Q1 2026 guidance represents a significant improvement — Ryerson expects to return to profitability:
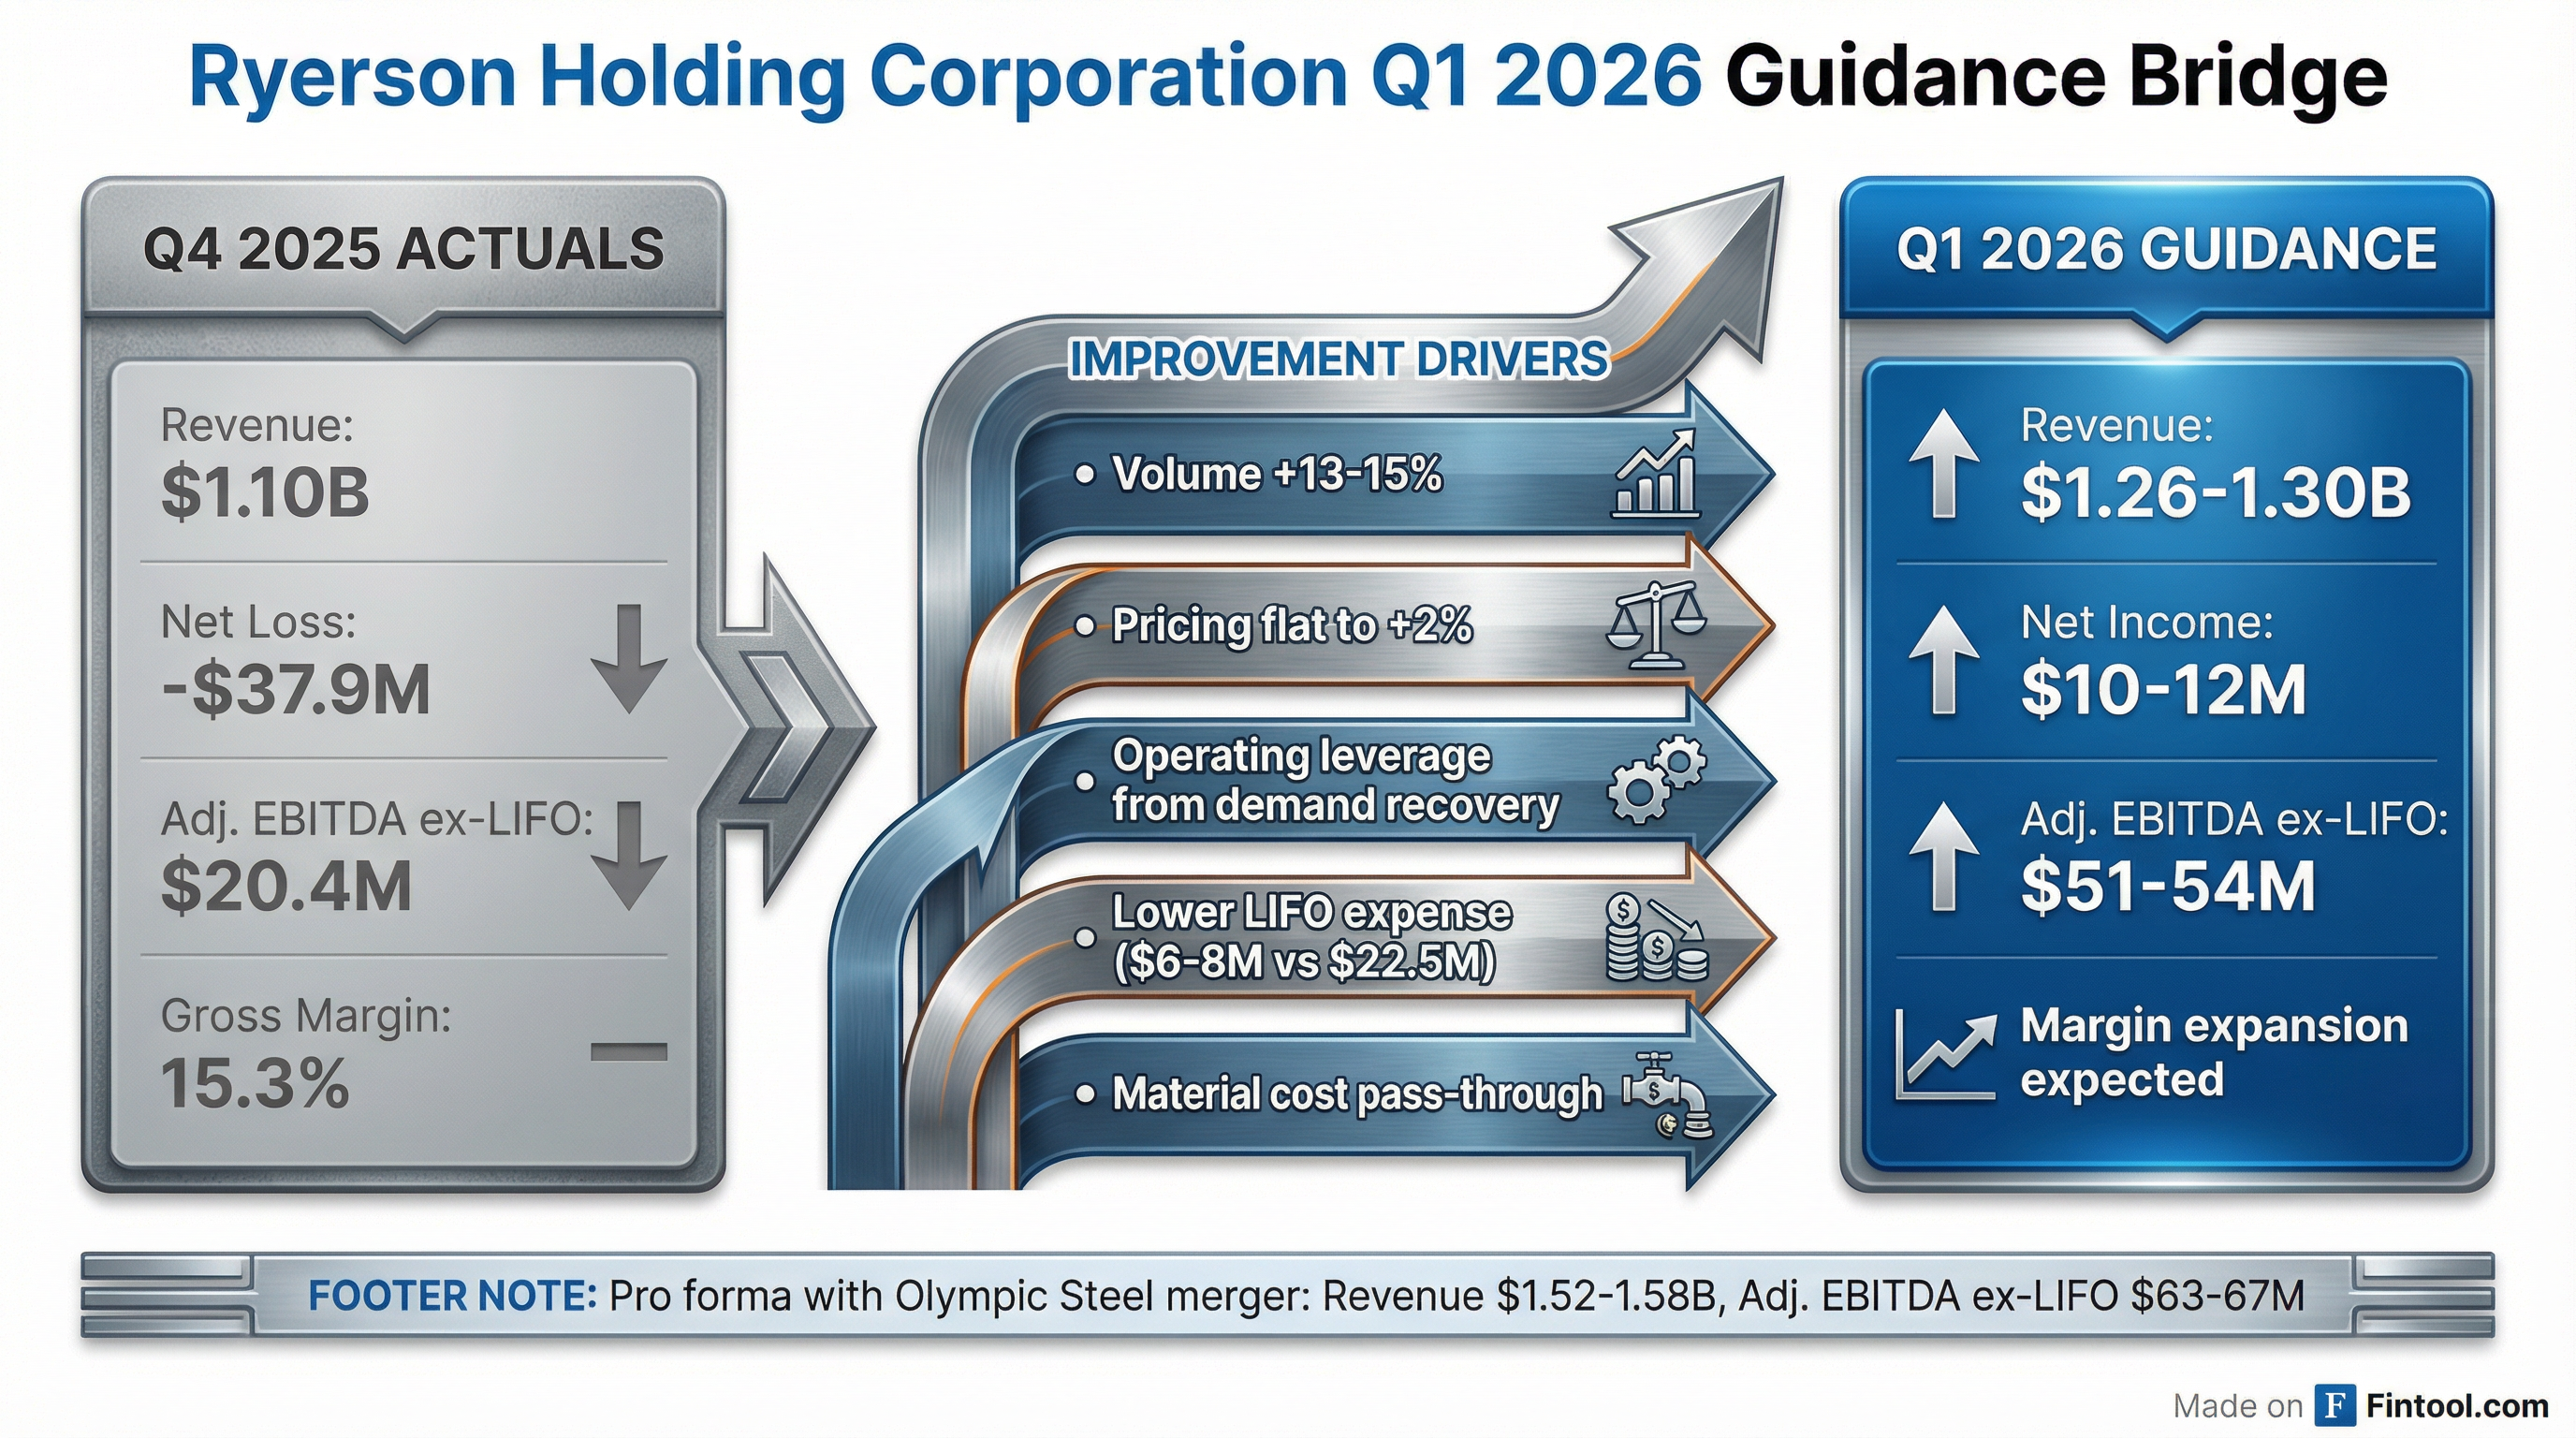
Key driver: Bookings in early 2026 have been "strong relative to years past" according to management, and Q4 inventory cost increases should flow through to Q1 selling prices .
What About the Olympic Steel Merger?
The transformational merger remains on track:
- Shareholder votes: February 12, 2026 for both Ryerson and Olympic
- Expected closing: Q1 2026
- Shareholder litigation: 14 demand letters and 2 complaints filed, but Ryerson/Olympic believe all allegations are "without merit"
Pro Forma Q1 2026 (if merger closes mid-February):
- Revenue: $1.52-1.58B
- Adj. EBITDA ex-LIFO: $63-67M
The combined company would create a larger, more diversified metals service center platform.
What Changed From Last Quarter?
Positive development: Despite the earnings miss, Ryerson generated $112.7M in operating cash flow during Q4, using the seasonal working capital release to reduce debt and bring leverage down toward its 0.5-2x target range .
Historical Performance Context
Ryerson has struggled with profitability amid soft industrial demand:
*Values retrieved from S&P Global
The company has now missed EPS estimates in 4 of the last 5 quarters, though 3 of those misses occurred amid challenging industrial demand conditions.
Key Risks and Concerns
- Merger execution risk: Shareholder lawsuits and integration complexity with Olympic Steel
- Industrial demand: Continued soft conditions in manufacturing end markets
- LIFO volatility: Material cost fluctuations create earnings unpredictability
- Leverage: At 3.1x, still above the 0.5-2x target range, though improving
Forward Catalysts
- Feb 12, 2026: Shareholder vote on Olympic Steel merger
- Q1 2026: Expected merger closing and first combined results
- Margin recovery: Q1 should see pricing catch up to Q4 cost increases
- Deleveraging: Continued debt paydown toward target leverage
This analysis is based on Ryerson's 8-K filing dated February 5, 2026. For the full earnings transcript, see RYI Documents. For company research, see RYI Overview.